GraphRAG
Knowledge Graph Retrieval-Augmented Generation
GraphRAG: Unlock Deeper Insights with Knowledge Graphs
GraphRAG extends the power of Retrieval-Augmented Generation (RAG) by leveraging the structure of knowledge graphs. Instead of simply retrieving documents based on keywords, GraphRAG builds a map of information where meaning is embedded into the connections themselves.
What is GraphRAG?
GraphRAG takes your documents and transforms them into a visual map of information. This map isn't just a collection of words; it's a network of ideas connected by relationships. The system understands not just what things are, but how they relate to each other.
Key Features
- Knowledge Graph Construction: Automatically builds a map of information from your uploaded documents.
- Interactive Visualization: Explore the generated map with an intuitive, interactive interface.
- Contextual Search: Find information that's relevant to your question, even if the exact keywords aren't present.
- Relationship Discovery: Identify hidden connections and relationships within your data.
- Data Table View: Switch from the map visualization to a list of information for detailed data inspection.
- Customizable Visualization: Control the map layout and appearance to make it easier to understand.
Using GraphRAG: A Step-by-Step Guide
The GraphRAG interface is divided into three main sections: a Top Toolbar, a Left Sidebar, and the Graph Visualization area.
1. Selecting Knowledge Bases (Left Sidebar)
- Knowledge Base Selection: The Left Sidebar displays a list of available Knowledge Bases. Select one or more bases to include in your map. Multiple selections allow you to combine information from different sources.
- Description Input: Below the Knowledge Base list, you'll find a text area for providing a description of the selected bases. This description helps the system understand the overall topic of the bases.
- Preview Document: For each selected Knowledge Base, a "Preview Document" button allows you to quickly view the content of the base to ensure you've selected the correct data.
2. Graph Generation (Top Toolbar)
- Generate Button: Once you've selected your Knowledge Bases and provided a description, click the "Generate" button in the Top Toolbar.
- Processing Time: Building the map can take some time, depending on the size and complexity of your data. The system will organize the information and create the connections. A progress indicator will be displayed.
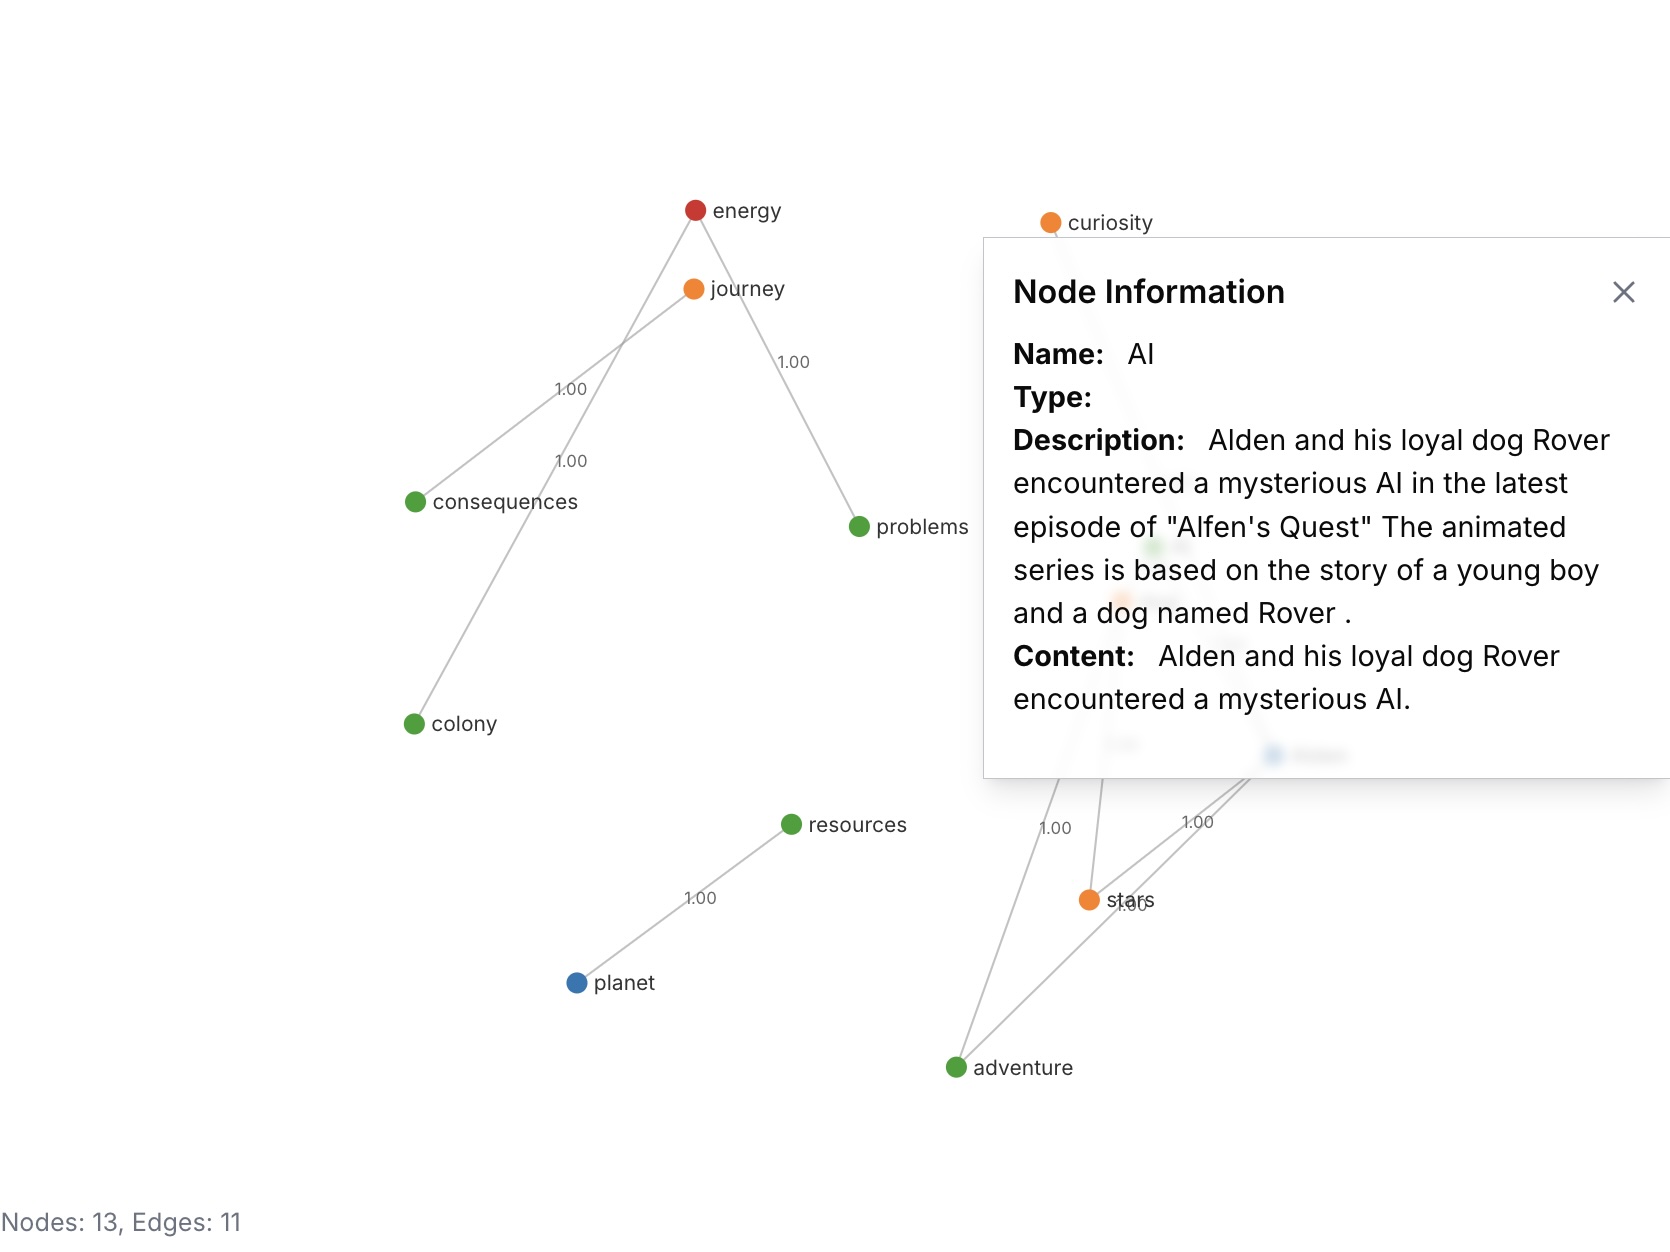
3. Exploring the Graph (Graph Visualization Area)

- Interactive Visualization: The Graph Visualization Area displays the generated map. You can:
- Move Nodes and Edges: Drag and drop items to rearrange the map for better clarity.
- Node/Edge Details: Click on an item to open a window displaying the details the system has identified.
- Toolbar Controls (Top Toolbar):
- Zoom In/Out: Adjust the view of the map.
- Download: Save the map as an image or data file.
- Show Voronoi: Highlight clusters of related items.
- Flat Layout: Simplify the map visualization.
- Show Properties: Display item details directly on the map.
- Select Categories: Filter the map to show only specific types of information.
- Node Visibility Threshold: Control the number of items displayed based on their importance.
- Data Table View: Switch to the Data Table View to see a list of information for detailed data inspection.
How GraphRAG Finds Information: Searching Meaning Across Relationships
GraphRAG doesn’t just look for keywords; it understands the meaning of your question and the relationships between ideas in your data. Here’s how:
-
Embedding Everything: The system takes all the information – the individual concepts (nodes) and the connections between them (edges) – and turns them into a list of numbers. These numbers represent the meaning of both the concepts and their relationships.
-
Semantic Search: When you ask a question, the system also turns your question into a list of numbers. It then compares those numbers to the numbers representing the entire graph – nodes and edges.
-
Finding Related Paths: The system doesn’t just look for things that are directly related to your question. It finds paths through the graph – chains of connected ideas – that lead to relevant information. This allows it to uncover hidden connections and provide more comprehensive answers.
This means GraphRAG can find relevant information even if you don’t use the exact same words as the documents. It focuses on what you mean and how things relate to each other.
Use Cases
- Research and Discovery: Explore complex topics and identify hidden connections between ideas.
- Knowledge Management: Organize and access information more effectively.
- Decision Support: Gain deeper insights to make informed decisions.
- AI Agents: Provide AI agents with a richer understanding of the world.
- Customer Support: Improve customer support by providing agents with access to a comprehensive knowledge base.